
TrueCap vs Excel: when is a spreadsheet still the right tool?
By TrueCap · built by a Philadelphia rental investor
You may already underwrite in an Excel or Google Sheets template. TrueCap offers a structured, mobile-friendly workflow with consistent calculations and editable screening benchmarks. A well-built, reviewed spreadsheet can still be the right tool for custom models.
Free analyzer: no card or signup
TL;DR
Pick TrueCap if
- You want to underwrite 5+ deals/week without losing your evening to spreadsheet maintenance.
- You need a tool that works on your phone at a showing.
- You share analyses with partners / lenders / clients.
- You want one documented calculation engine instead of maintaining formulas.
- You want address-first HUD rent and FRED rate benchmarks with a manual local tax input.
- You want PDF reports without manual print-to-PDF formatting.
Stick with Excel if
- You analyze fewer than 5 deals/year and have a working template.
- You have a highly customized model (waterfalls, complex partnership splits, exotic financing).
- You need offline use.
- You're a financial analyst by training — Excel is muscle memory.
- You require complete data privacy (everything stays on your machine).
Feature-by-feature
Where each wins, where it's a wash.
| Feature | TrueCap | Excel / Sheets |
|---|---|---|
| Time to first underwrite | Address-first form with editable benchmark defaults | Depends on template setup and the evidence already gathered |
| Starting values from address | Editable HUD rent and FRED rate benchmarks; manual property tax | Manual entry or a custom data integration |
| Formula consistency | One documented calculation engine; inputs still require review | Depends on the template, formulas, protections, and review process |
| Mobile usable | Mobile-first responsive web app | Mobile apps available; complex sheets may require more navigation |
| Shareable with team / client | Free read-only public link; Pro adds co-branding | Share a workbook or controlled cloud-sheet link |
| Live updates as you change inputs | Instant recalc, visual indicators of impact | Recalculates instantly; change tracking depends on the workbook |
| 10-year projection visualization | Pro built-in chart; Pro also compares up to four saved deals | Available when the workbook is built for projections and comparison |
| Sensitivity analysis (stress test) | Pro — rent ±10%, vacancy ±5pp, rates ±1pp in one view | Possible with a Data Table or a scenario sheet you build |
| Customization to unusual scenarios | Structured inputs; unsupported scenarios may need another model | Highly customizable when the author can build and review the formulas |
| Free to start | Yes — unlimited free analyses, no signup | Yes if you have Excel/Sheets |
| Offline use | Requires internet | Desktop Excel works on local files; Google Sheets needs offline access turned on |
| Audit trail / version history | No per-deal revision history; Pro can edit saved deals | Cloud sheets may provide version history; local files need a process |
| Glossary / explanation of metrics | Inline tooltips + a real estate glossary with full definitions per term | None built in; add your own notes or links |
| PDF export for review | Included with Pro | Print or export to PDF with workbook-defined formatting |
| Cost | Free core and paid Pro — see live pricing | $0 if already licensed; otherwise plan-dependent |
Excel details were checked against Microsoft's support pages for data tables, version history and PDF export in October 2026. Google Sheets differs in places; check Google's own help pages.
When a structured workflow may fit better
- You repeat the same underwriting workflow. Structured inputs can reduce template maintenance while preserving editable assumptions.
- You share results without sharing formulas. TrueCap's free read-only link separates review access from model editing.
- You work from a phone. The responsive interface is designed for smaller screens; spreadsheet usability depends on the workbook.
- You want one calculation definition. TrueCap applies the same documented engine each time, while a spreadsheet remains as reliable as its formulas, inputs, and review process.
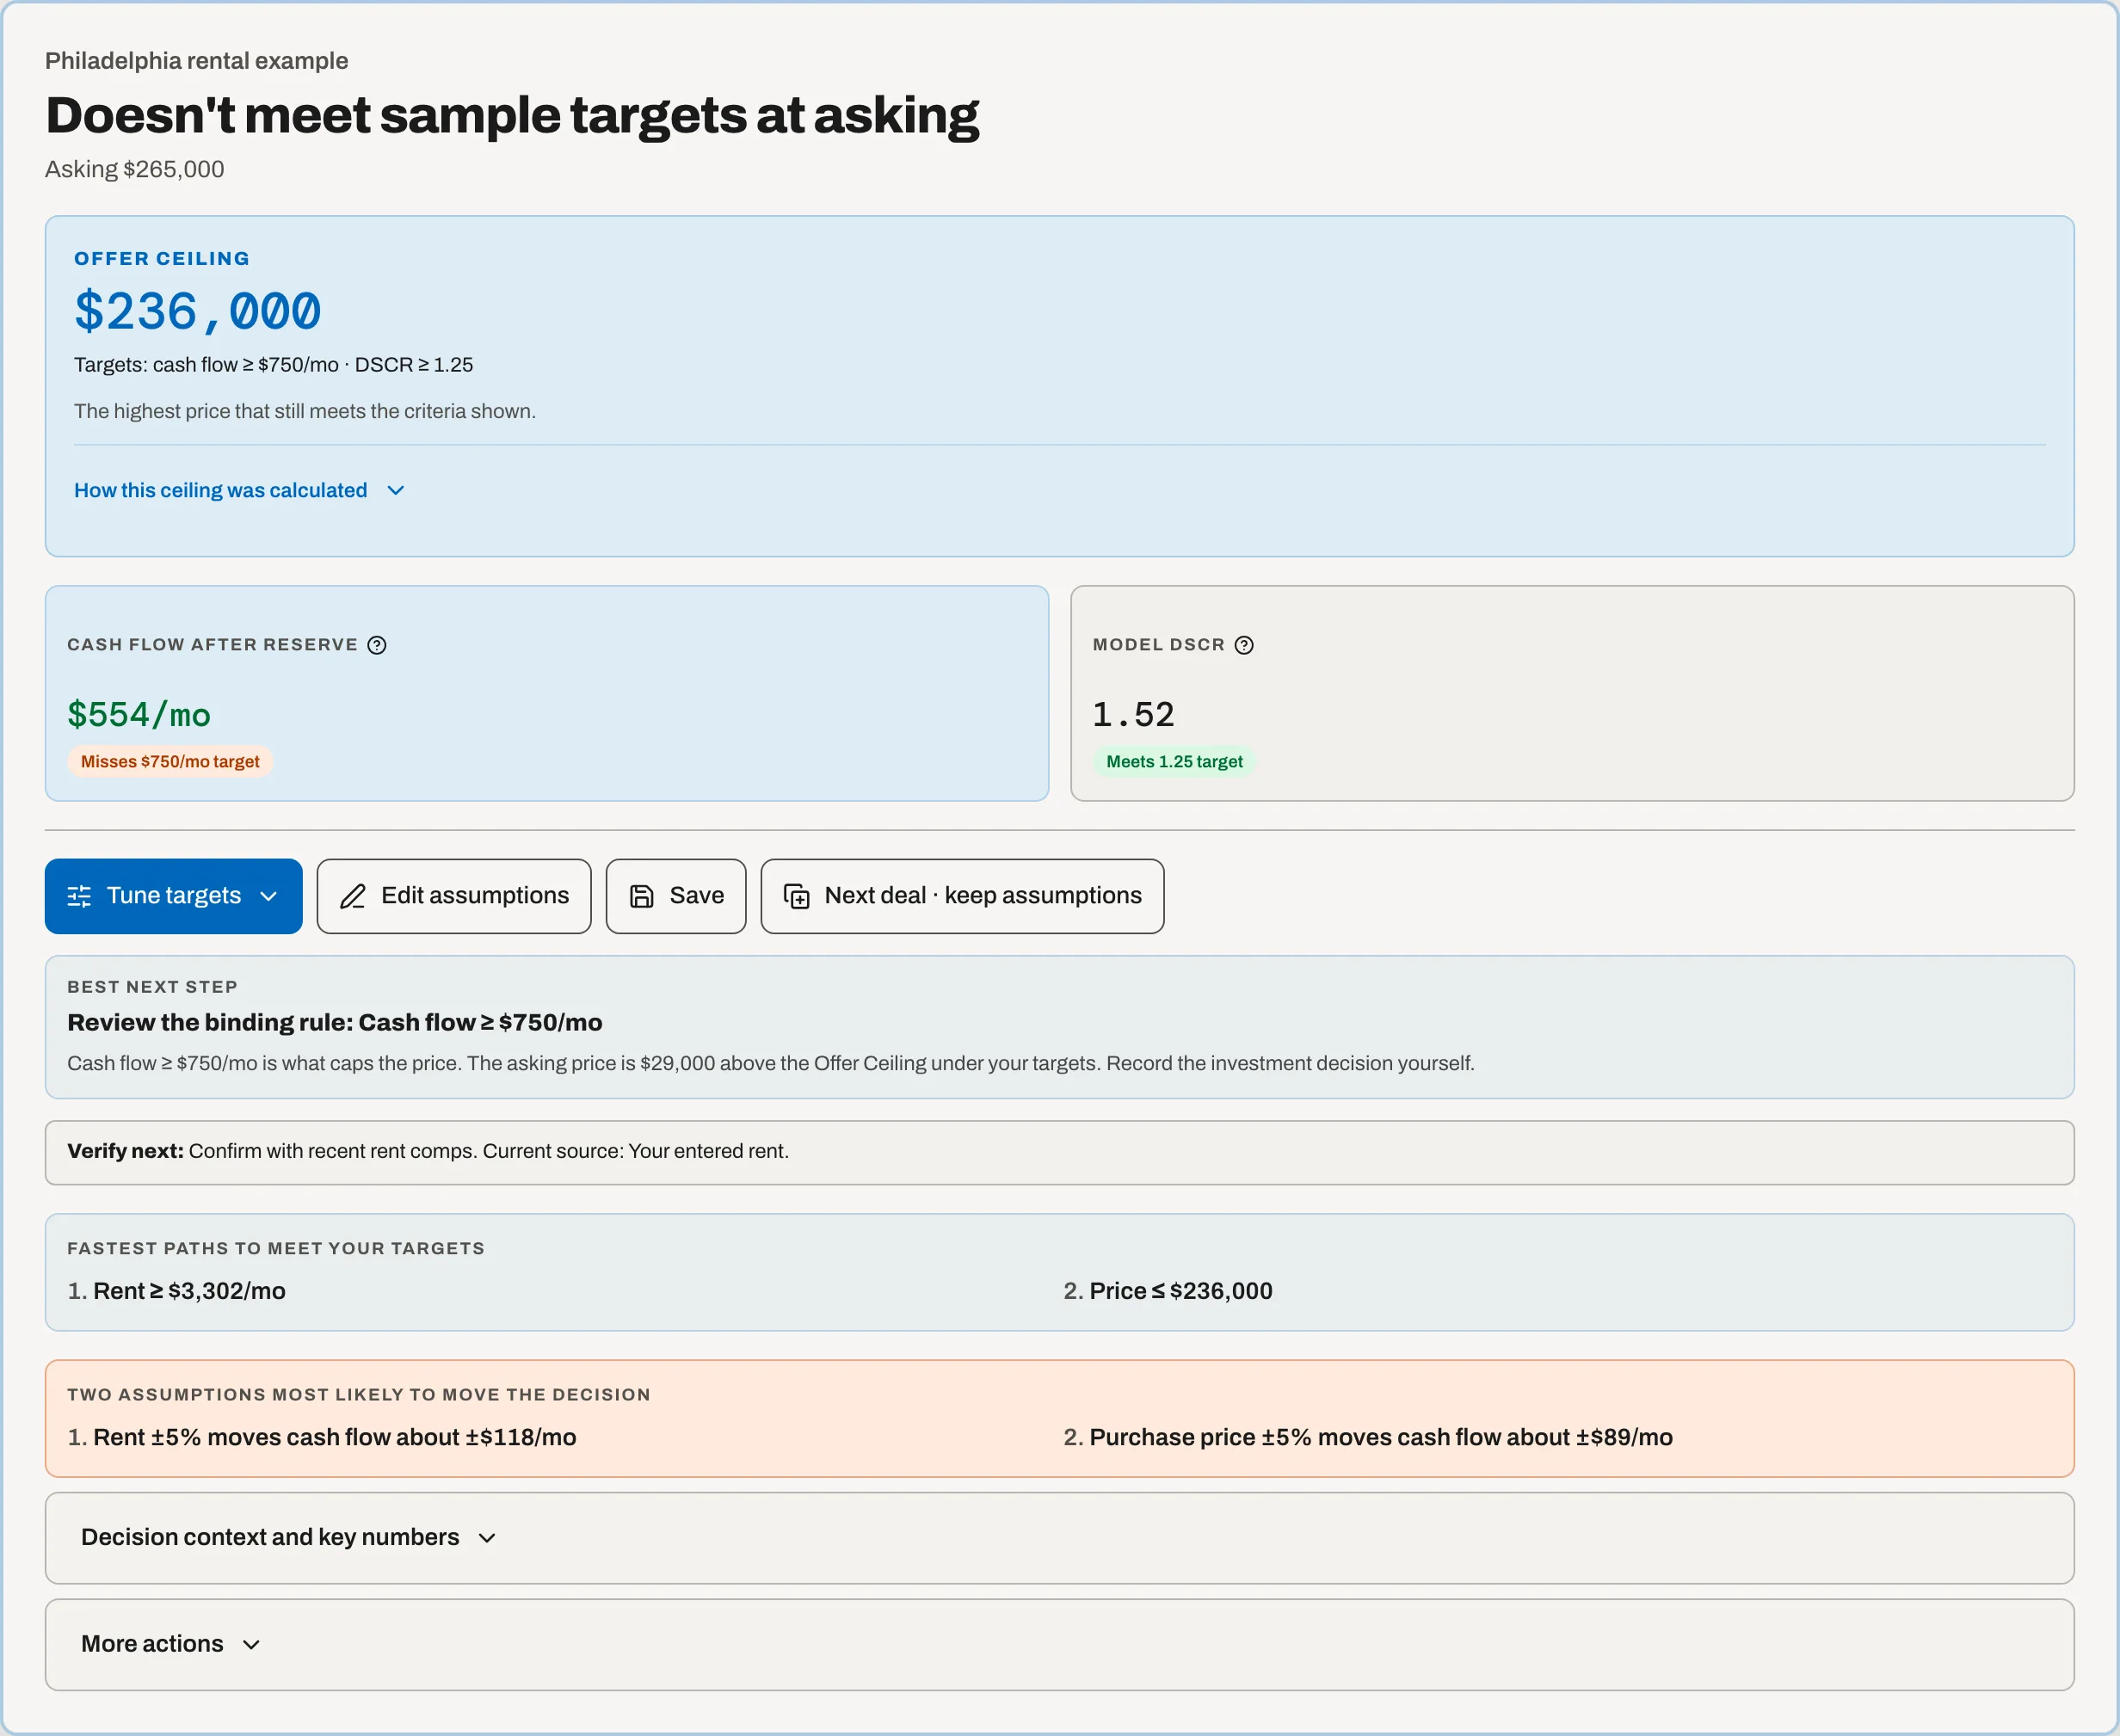
Want to sanity-check one formula before you trust a whole sheet? Check your payment row against the mortgage payment calculator, then read your sheet's cap rate and coverage ratio back against the worked examples in how to calculate cap rate and how to calculate DSCR. When you want those numbers produced from an address, the asking price and a bedroom count instead of a sheet of typed inputs, the full TrueCap analyzer computes them on one documented engine. And if you're building the income statement by hand, our guide to a rental property pro forma walks through every line a spreadsheet should have.
Common questions about TrueCap vs Excel
Quick answers to the questions investors comparison-shopping these tools actually ask.
Is TrueCap better than an Excel rental analysis template?
It depends on the workflow. TrueCap provides structured inputs, a documented calculation engine, read-only sharing, and a mobile-responsive interface. A reviewed spreadsheet can be more flexible for custom acquisition models, partnership waterfalls, or financing structures TrueCap does not support.
Why is a spreadsheet risky for underwriting rental deals?
A spreadsheet requires its own controls. Review formulas and named ranges, protect calculation cells, document assumptions, manage versions, and test the workbook after changes. Mobile usability also depends on the workbook's complexity and layout.
Can I import my Excel rental template into TrueCap?
Not directly — TrueCap uses a structured form so the inputs match the engine. Enter price, rent, financing, vacancy, management, tax, and insurance in the structured form. Address lookup supplies editable HUD rent and FRED rate screening benchmarks; property tax stays manual. Replace them with property-specific evidence.
Does TrueCap handle BRRRR and fix-and-flip like my spreadsheet does?
Not currently. TrueCap's rehab, ARV, and rental calculators cover individual inputs, but TrueCap has no BRRRR or fix-and-flip model. Keep a reviewed spreadsheet or use another tool for dated contributions, renovation financing, refinance or sale proceeds, and project-level returns.
What if I still want to use Excel after trying TrueCap?
That can be the right choice. Keep a reviewed Excel template for edge cases such as partnership splits, syndication waterfalls, or custom debt structures the underwriting engine doesn't model. TrueCap includes PDF reports with Pro for sharing a review snapshot while keeping the spreadsheet as the custom back-office model.
On price, plainly
Tools in this space run from free to well above TrueCap — check Excel's live pricing for their current number. What TrueCap's price buys is the decision layer, not more calculation: an Offer Ceiling for your targets, Buy Box fit with reasons, the downside stress test, and assumptions that are source-labeled instead of silently defaulted. Whether that workflow justifies the price depends on your volume, verification process, and existing tools.
Screening listings for investor clients? TrueCap for agents keeps a client roster and screens each deal against the Buy Box of the client you assign it to.
Try TrueCap free.
Try the structured workflow with one property, review every assumption, and keep Excel for any custom modeling that TrueCap does not support.
About TrueCap
TrueCap is built by one person, a rental investor in Philadelphia. It started as the tool he wanted for his own underwriting — a way to get from an address to a source-labeled first-pass answer — and it's still how he runs the deals he considers.