
The numbers that decide whether to hold — in one screen.
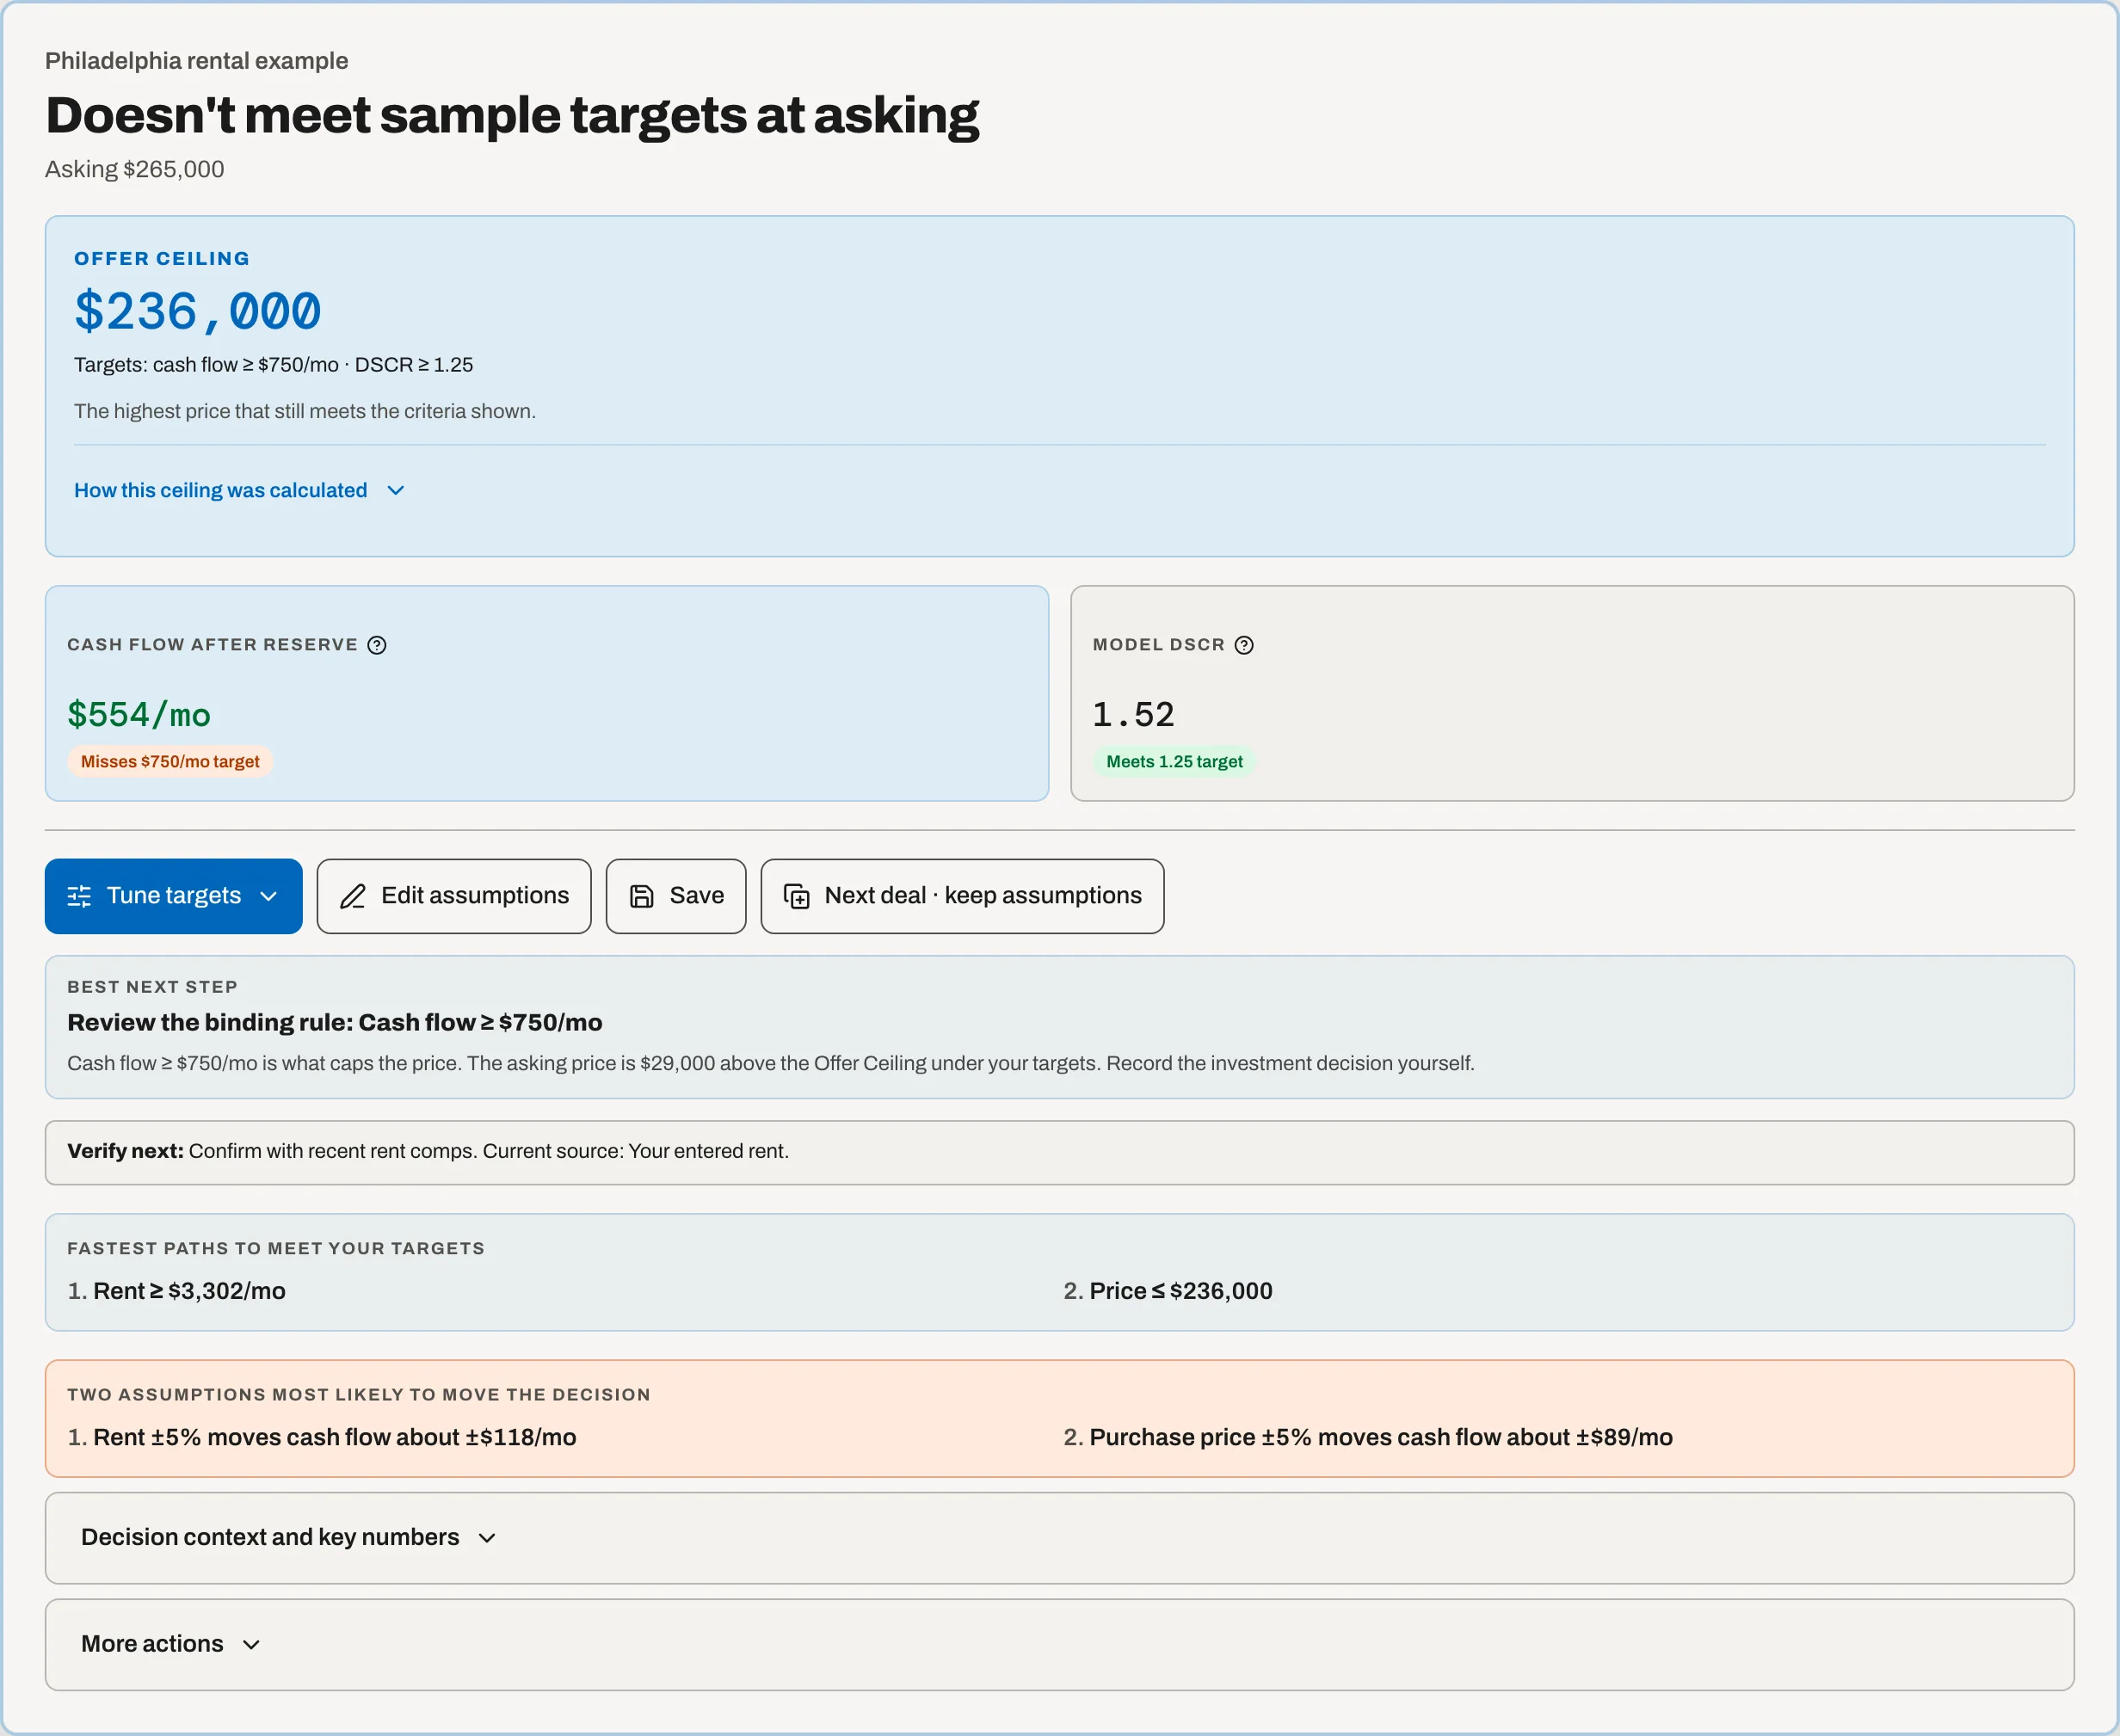
Screen cap rate, cash-on-cash, DSCR, and cash flow free. Pro adds Offer Ceiling, sensitivity, and 10-year cash-flow and equity projections using labeled, editable starting data.
Free screen: no card or signup. Your first complete decision includes the Offer Ceiling.
Built for the hold strategy
Four jobs serious rental investors do over and over — faster, easier to audit, and more consistent.
- Triage listings with a consistent first pass
- For a supported address and asking price, review editable cap rate, cash-on-cash, and DSCR assumptions.
- See year-1 vs year-10 in one view
- The Pro planning view carries editable rent growth, expense growth, appreciation, and financing assumptions through 10 years. It compares scenarios; it does not forecast a winner.
- Track cash flow and equity over time
- The 10-year planning view carries editable rent and expense growth through the hold while scheduled debt paydown changes equity. It is a scenario, not a forecast.
- Stress-test before you offer
- The Pro sensitivity grid shows how modeled metrics respond when rent moves ±10%, vacancy moves ±5pp, and rates move ±1pp.
How a buy-and-hold investor uses TrueCap
- Enter the listing address, the asking price and a bedroom count. A HUD rent benchmark can pre-fill the rent. The Buy & Hold starter supplies an interest rate and a property-tax rate, labeled with the starter's name. They are placeholders: replace them with your quoted rate and the local tax bill.
- Adjust the financing (down %, term, rate) to match the offer you're considering.
- Run the analysis to see cap rate, CoC, DSCR and monthly cash flow.
- Pro: open the 10-year planning projection to review cash flow and equity under the entered growth assumptions.
- Pro: stress-test in the Sensitivity grid before you write the offer.
- Save the deal. The portfolio rollup in My Deals shows your aggregate cash flow across everything you're considering.
Why long-term investors pick TrueCap over a spreadsheet
- Multi-year assumptions stay visible.
- See rent growth, expense growth, debt paydown, cash flow, and equity in one reproducible planning view.
- Scenario boundaries stay explicit.
- The projection is not a market forecast, appraisal, sale model, or tax-return calculation.
- Sensitivity is built in.
- Hard to do thoroughly in a spreadsheet — trivial here.
- Portfolio view.
- Save your deals, see total cash flow + weighted cap rate across the book.
- Traceable screening defaults.
- The HUD rent benchmark shows its source, and the Buy & Hold starter's interest rate and property-tax rate carry the starter's name. Replace every first-pass value with property-specific evidence before offering.
Recommended reading for buy-and-hold investors
The handful of guides and calculators long-term investors return to most often: the 60-second underwriting workflow, the deep-dive on cap rate vs cash-on-cash vs DSCR, the breakdown of every deductible expense, and the TrueCap analyzer for quick listing triage — cap rate, cash-on-cash, and DSCR from an address, the asking price and a bedroom count.
Free screens the purchase. Pro solves and stress-tests the offer and hold.
Free gives you cap rate, CoC, DSCR, monthly cash flow, the 0–100 Deal score, and read-only share links for a first-pass screen. Pro adds 10-year cash-flow and equity projections, sensitivity, Offer Ceiling, saved-deal comparison, PDF exports, and co-branded share links.
Also evaluating an owner-occupied rental? See TrueCap for house hackers.
Are you an agent working with investor clients? See TrueCap for agents